Valentia Observatory
At a Glance
Atlantic Setting
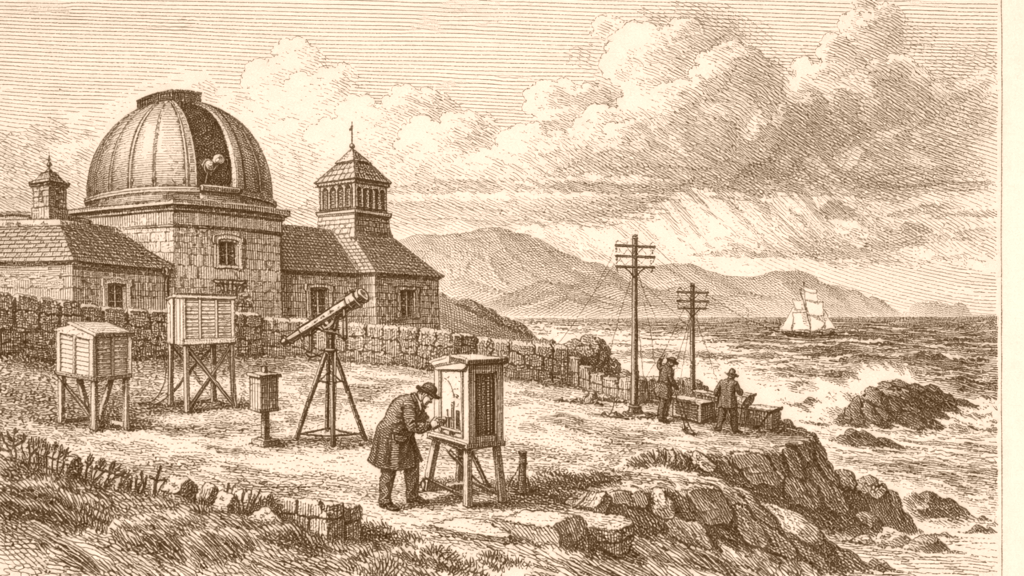
Valentia Observatory is identified with a Kerry site one kilometre west of Cahirciveen, and its name comes from its earlier location on Valentia Island. The site mattered because it lay in the path of Atlantic weather systems, and the first real-time weather observation was transmitted from the island in October 1860. The observatory later moved from the island to its present location, while the main building, Westwood House, was built in 1866. [1]
The observatory’s history also shows institutional change. It was set up in a house leased from the Knight of Kerry in 1868, and it remained on the island until 1892. Later, the British Meteorological Office continued to staff and fund it until the Irish Meteorological Service was established in 1936. The British office then ran it on an agency basis until Irish staff were trained by late September 1937. [1]
Observing Network
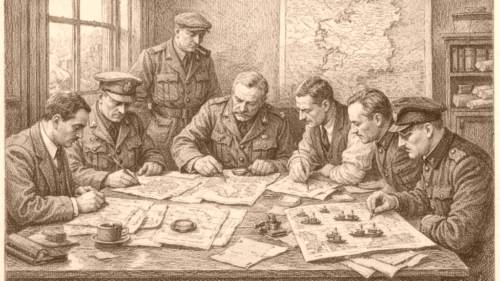
Irish climate observation did not begin with Valentia alone. Records for temperature note organised weather observations in the late eighteenth century, with observatories in Dunsink and Armagh, followed in the nineteenth century by readings at Birr Castle, Markree Castle, the Phoenix Park and Trinity College Dublin. By the mid-nineteenth century some standardisation had begun, and by the mid-twentieth century there were over 100 locations measuring temperature. [2]
The temperature record also shows how modern climate analysis depends on long series from a small number of stations. Met Éireann states that the national long-term mean temperature series for Ireland was derived from five spatially distributed stations, including Valentia Observatory, and that Valentia was recognised by the World Meteorological Organization as a Centennial Observing Station in 2017. The same account emphasises that historical observations cannot be retaken once lost. [2]
Rainfall Records
Rainfall observations followed a similar path of extension and organisation. Met Éireann links organised rainfall measurement to the late eighteenth century and names the same nineteenth-century stations that appear in the temperature history. By the early twentieth century there were over 100 rainfall locations, and by 1936 the number of rain gauges had risen to more than 200. The network later expanded further to just under 500 locations across the country. [3]
Valentia Observatory appears again in the rainfall record as one of the stations with a nineteenth-century observational series, alongside Phoenix Park. The Met Éireann rainfall page says that more than 9.5 million hourly rainfall measurements were stored in the National Climate Database between 1939 and 2017, and that long-term stations are crucial for analysing climate change. It also notes Valentia’s acceptance in 2017 as one of the inaugural centennial observing stations worldwide. [3]
Measurement Methods
The observing network is also defined by the instruments used. On the temperature page, Met Éireann describes the Stevenson screen as the standard enclosure that shields instruments from precipitation and direct heat radiation, and notes that Irish surface air temperature is traditionally measured in degrees Celsius inside that shelter. It also says temperatures were once read once a day at 9 UTC, while newer stations can provide minute-by-minute readings. [2]
The same source makes clear that measurement practice has changed with technology and station exposure. It notes a shift from mercury-filled thermometers to platinum resistance thermometers at automatic stations and airports, with a project underway to replace mercury thermometers more widely. It also warns that changes in instrumentation, observer, location, or nearby buildings and trees can create inhomogeneities in the data series. [2]
Climate Uses
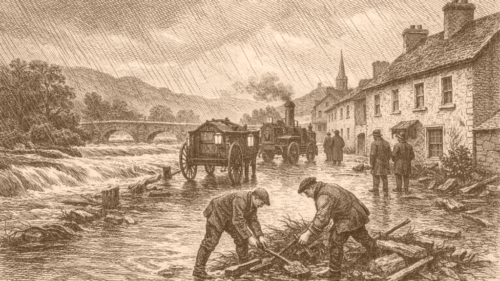
Met Éireann’s rainfall material shows how climate records are used beyond observation. It says rainfall measurements are essential for assessing climate effects on the water cycle, water balance, and flood mitigation. It also states that return values for rainfall depths are required by engineers, architects and others for drainage schemes, sewerage systems, bridges, gutters, and fluvial flood mitigation measures. The document links these estimates to specific rainfall-duration and return-period models. [3]
A further engineering use appears in the rainfall section’s discussion of driving rain. Met Éireann says the map of driving rain for vertical surfaces was produced for use in building design to support climate change adaptation in Ireland, and that the impacts of rain on buildings depend on intensity, duration, wind speed and wind direction. The same section notes that the new map supersedes earlier versions and should be adopted by decision makers. [3]
Energy Links
Climate observation in Ireland sits beside other forms of infrastructure development, though the evidence here keeps them distinct. The ESB archive presents the Shannon Scheme as a major hydroelectric project centred at Ardnacrusha in County Clare, initiated in 1925 and completed in 1929. It describes the scheme as the beginning of large-scale electrification in Ireland and says it harnessed the River Shannon to generate electricity. [4]
The same archive gives a sense of the project’s scale through its figures and images. It records a budget of £5.1 million, says 5,000 workers were on site, and notes that the project’s success led to the establishment of the Electricity Supply Board in 1927. The archive also lists construction photographs, transmission systems, and work at the power station, showing the industrial character of the scheme. [4]
Source References
Hover over a number to see the source. Select it to open the source.

How did Irish climate observation and related infrastructure develop from the nineteenth century into the present, as reflected in Valentia Observatory, national rainfall and temperature networks, and climate-related engineering uses?